Description
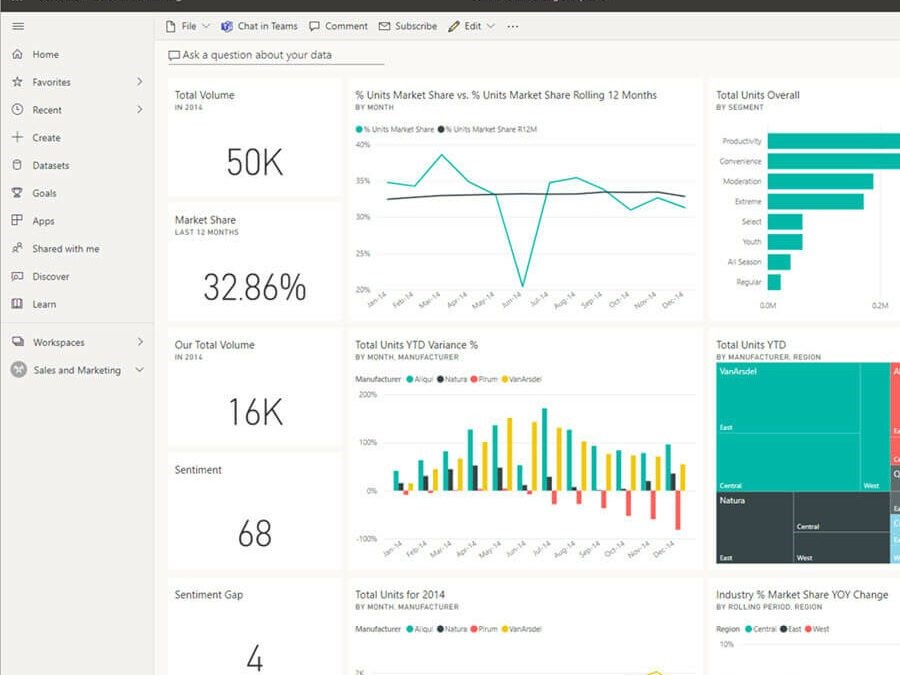
A Business Intelligence (BI) Dashboard is a dynamic visual interface that provides decision-makers with an at-a-glance overview of key business metrics and performance indicators. Designed to aggregate and visualize data from multiple sources—such as CRM systems, financial software, marketing tools, supply chain management platforms, and HR databases—BI dashboards convert raw, complex information into easy-to-understand visualizations. These include line graphs, bar charts, pie charts, heat maps, and data tables, all of which update in real-time as new data flows into the system. Users can filter data by time period, location, department, or specific variables to focus on the information most relevant to their objectives. This makes it easier to identify trends, spot inefficiencies, and make data-backed decisions that improve business performance. Modern BI dashboards often include predictive analytics, anomaly detection, and alerts to highlight potential risks or opportunities. They also support collaboration by allowing users to annotate charts, share dashboard views with team members, and generate custom reports for presentations or stakeholders. Advanced dashboards offer drill-down functionality, allowing users to click on a metric and explore the underlying data in detail. Integration with tools like Microsoft Power BI, Tableau, Looker, or Qlik provides scalability and flexibility for enterprises of all sizes. Whether monitoring sales performance, tracking marketing ROI, assessing financial health, or evaluating customer satisfaction, BI dashboards empower users to turn data into insight—and insight into action. By promoting a culture of transparency and accountability, these tools help businesses respond more quickly to challenges, identify new growth opportunities, and measure progress against strategic goals.


Adams –
Easy to use and visually intuitive. The BI Dashboard helped us spot bottlenecks in our contract approval process, which improved turnaround times significantly.
Ronke –
With this BI tool, our contract management became much more strategic. We now have clear KPIs and performance metrics that guide negotiations and renewals.
Tolulope –
The BI Dashboard has completely transformed how we manage our contracts. We can quickly track contract statuses, monitor deadlines, and analyze vendor performance all in one place.
Isaiah –
The dashboard’s integration with our existing CRM and document systems is seamless. We get a consolidated view of contract compliance and financial impact, which boosts transparency across departments.
Dahiru –
This dashboard gives us real-time insights into our contract portfolio. The customizable reports help us identify risks early and make data-driven decisions with confidence.